

Learn, recognize, apply
Stock Trader’s Handbook is a comprehensive resource for investors who want to master technical analysis and understand the fundamentals of stock trading, with in-depth explanations, practical insights and real-world examples.
Stock trading courses
Our free stock market courses turn the library into step-by-step learning paths. Each one is free, needs no sign-up, and takes you from one lesson to the next.
- Stock Market Basics CourseLearn stock market trading from zero: how the market works, orders, brokers and the vocabulary.Beginner · 1 lessons live
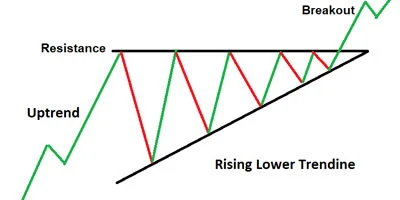
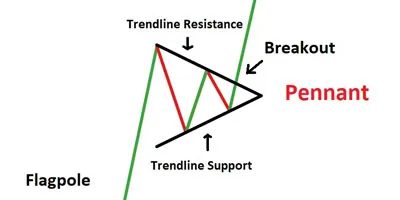
- Chart Patterns CourseRead candlesticks and recognize the classic chart patterns: cup with handle, double bottoms, triangles, flags and more.Beginner to Intermediate · 7 lessons live
- Technical Analysis CourseSupport and resistance, trend, volume and the indicators traders use most: moving averages, RSI, MACD and more.Intermediate · 0 lessons live
- Day Trading CourseWhat day trading really involves, the indicators day traders watch, and the risk rules that come first.Beginner to Intermediate · 2 lessons live
- Trading Strategies CourseBreakouts, momentum, swing trading, entries and exits, position sizing and the psychology that holds it together.Intermediate to Advanced · 0 lessons live
The Model Book: study the market’s greatest winners
The Model Book showcases some of the stock market’s greatest historical winners, examining their breakout points, key chart patterns and significant price movements, so you can recognize the characteristics of successful stocks before the next one runs. Failed breakouts are studied too, because knowing what a weak setup looks like matters just as much.

Learn to read chart patterns
Chart patterns are the core of technical analysis. Start with the chart patterns overview, then study each one.
Explore the library
- LearnStock market basics for new investors: how the market works, orders, brokers and the words traders use.2 lessons live
- Technical AnalysisThe encyclopedia: chart reading, candlesticks, chart patterns, indicators, volume and trend.7 lessons live
- Trading StrategiesHow traders find opportunities, time entries and exits, size positions and manage risk.2 lessons live
- Model BookHistorical winners (and failed breakouts) studied chart by chart: bases, breakouts, volume and what followed.0 lessons live
- Market StudiesBull and bear markets, cycles, breadth, accumulation and the behavior of leading stocks.0 lessons live
- Trading ToolsFree calculators and checklists: position size, risk/reward, stop-loss, gains and compounding.0 lessons live
- Advanced TradingAdvanced chart analysis, market psychology, institutional trading, sector rotation and systems.0 lessons live
Popular lessons
- Cup with Handle PatternThe classic bullish base: how to read the cup, the handle, the buy point and breakout volume.Intermediate · 5 min read
- Candlestick PatternsHow to read candles and the main single, two- and three-candle patterns, with their limits.Beginner · 5 min read
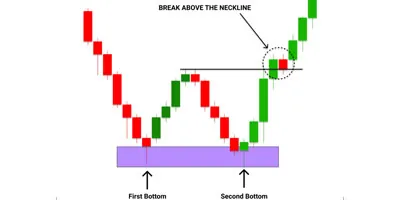
- Double Bottom and Double TopThe W base and the M top: buy points, the undercut, volume, confirmation and failures.Intermediate · 6 min read
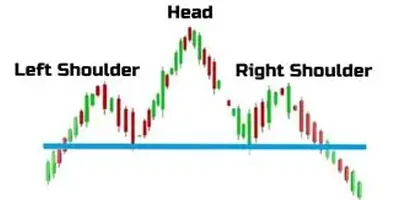
- Head and Shoulders PatternThe classic reversal pattern: shoulders, head, neckline, volume, confirmation and the measured move.Intermediate · 7 min read
- How the Stock Market WorksWhat a stock is, how orders meet on an exchange, what moves prices and who protects investors.Beginner · 7 min read
- Day Trading for BeginnersWhat day trading really involves: margin rules, costs, basic strategies and the risk rules that come first.Beginner · 6 min read
Frequently asked questions
Are these stock market courses really free?
Yes. Every course and lesson on Stock Trader’s Handbook is free to read, with no sign-up and nothing to buy. The site is an educational library.
Where should a beginner start?
Start with the Stock Market Basics Course to learn how the market works and how orders are filled, then move on to the Chart Patterns Course.
What is technical analysis?
Technical analysis is the study of price and volume charts to judge supply and demand for a stock. Traders use it to find entry points, place stops and decide when to sell.
What is the Model Book?
The Model Book is a collection of historical stock market winners, and failed breakouts, studied chart by chart: the base each stock formed, its breakout point and volume, and what happened next.
Is this investment advice?
No. Everything here is general education. It is not a recommendation to buy or sell any security, and it doesn’t consider your personal situation. Trading involves risk of loss.